Remote Sense Data for Dispersion modelling
Important for the emergency preparedness is the ability to before an event evaluate a number of probable scenarios. This can be done using the Decision Support System [DSS] Argos. It is used by SSM (Swedish Radiation Safety Authority) but also available for other authorities. The project idea is to enhance the decision basis for risk analysis for authorities involved in the case of release of toxic agents using information from VHR (Very High Resolution) satellite data. By providing Argos with enhanced input data the decision support is enhanced regarding dispersion calculation.
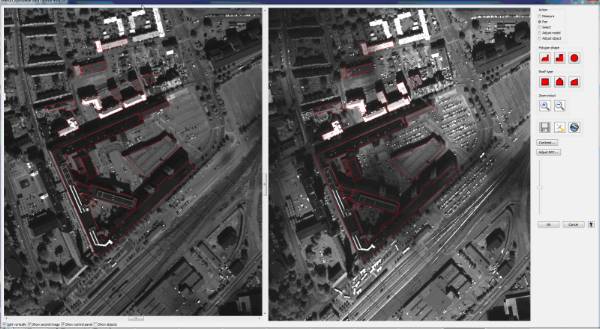 CityModeler 5.0 view. The height of the buildings is evaluated by comparing two pictures taken from two slightly different angles. The two images in the stereo pair is are here overlaid by measured building polygons.
In this project the METRIA CityModeler workflow has been tested and developed for the purpose of delivering 3D-data to Argos. Moreover the project has developed and tested methods for delivering datasets on roughness height. The last parameter is used in NUD, the urban dispersion model embedded in Argos, as a scale related to the overall turbulence.
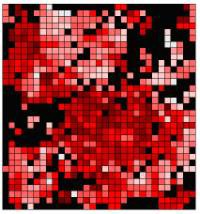
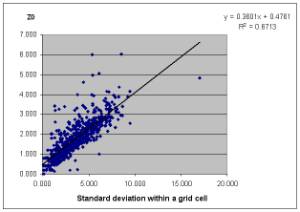
To the left darker red represents higher value of z0 computed from building polygons in cells of 100m x 100m. Black cells lack polygons.To the right regression curve for grid values z0 and elevation standard deviation within grid cells.
By using CFD (Computational Fluid Dynamics) models as a replacement of the real world an algorithm for calculating the efficient height is developed. This algorithm is used when transferring the identified height of buildings and their types of roof, to a dataset that can be imported into NUD (within Argos and then used for dispersion calculation). The CFD-study has included a number of configurations with different height and roof types.
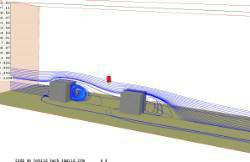
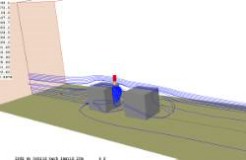
One configuration studied was the distance between buildings. The effect of the skimming flow is seen in the picture to the left where streamlines tend to pass over the building downstream. With increased distance the flow can be characterized as an isolated flow.
By comparing the flow velocities around the buildings with statistical performance methods a best fit between flow with gabled roofs and flat roofs with different heights can be established.
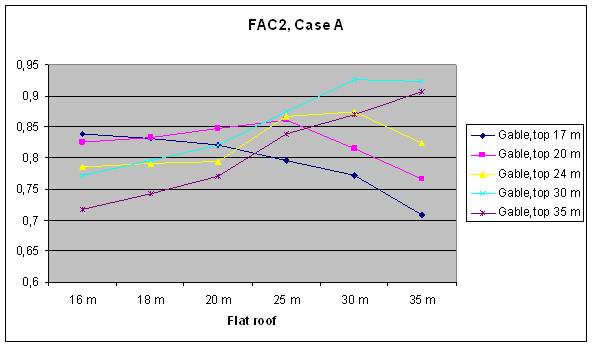
Each line represents a certain configuration. The maximum value indicates the closest fit to an efficient height where it can be replaced with a flat roof representative, in the model. The gabled roof gives a tendency that the efficient height will overshoot the rooftop value. FAC2 means factor of two. If two points compared are within a factor of 2 the result is 1 if not the comparison gives the result 0. All results summed and then divided by the number of pairs gives the value of FAC2.
Finally a comparison study is performed to evaluate the effect of using efficient heights instead of only using the height of the eaves to define the height of building polygons.
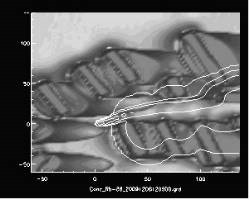
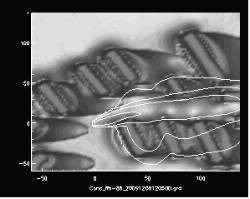
A fictous contaminant source generates a serie of puffs which then is transported by the wind. The flow is channelized between the buildings. Some of the released material is dispersed in the wakes behind the buildings in the south-east part. Building data is imported from the dataset A (height from eaves, left figure). The Efficient height is applied to the figure to the right. The wakes are larger and the plume is distorted compared with the figure to the left.
When comparing the Figures above it is clear that only by changing the height of the buildings major changes to the pathways of the released contaminants occur. It underlines the initial assumption that it is important to have as good input data as possible. Regarding which data is the correct data there is still need of some verification.